
James Kanagasooriam
Chief Research Officer

We look at whether the rise of Reform UK poses an existential threat to Conservative Party and why people feel drawn to Reform in the first place.

Does the rise of Reform UK pose an existential challenge to the Conservatives? And are economic issues behind this, or are social issues really driving differences in public opinion?
In this week’s Bi_Focal, which comes in two parts, we analyse two things. In Part 1 we look at the rise in polling numbers for Reform, and the degree to which this poses a challenge to the Conservative party support base. TL;DR - a great deal, but not 1993 Canada style. To answer this broad question we cover methodological differences in how we measure smaller parties like Reform and the Greens, the demographics of the Reform vote, and a look at the motivations of why people feel drawn to Reform in the first place. We’ve been able to do this, by conducting a survey of around 500 current Reform voters as well as a larger nationally representative sample.
In Part 2 - to be published later this week and also connected to the rise of Reform - we try to and really understand whether our politics is back to economics and issues of cost of living, or really whether our post-Brexit politics is operating on a social/culture war axis. TL;DR - politics is still about social issues and economic ones, but we’re not convinced that economics will be the primary axis of division until a Labour Government makes economic moves that putatively hit people at the higher end of the wealth and income spectrum.
Here at Focaldata, we ran a survey of 2,700 respondents (of which weighted n=171 Reform voters) along with a targeted booster poll of 468 Reform-intending voters, with data collected between 21/12/2023 and 16/01/2024 (note: the booster sample data was only used in the section on Reform pull/push and not in voting intention and attitude mapping).
How voting intention is asked differs across pollsters, and one methodological difference makes a large difference to Reform numbers: whether you prompt for smaller party names in the survey. To test how big this difference was we split our sample in half (i.e., a A/B test) where one ballot question for the next election had all the parties listed (prompted) and another with only the three major parties (Conservative, Labour and Liberal Democrat), and then smaller parties shown if 'Other' is chosen.
We find the vote % is around 2-3pp higher for the smaller parties when prompted vs unprompted. The Greens took a particular knock without prompting, more than halving their vote share from 6.5% to 3.2%, while Reform lost almost a quarter their support from 8.8% to 6.8%. The Conservatives are the main beneficiary of asking unprompted surveys - which is interesting: it’s not just about Reform-inclined voters picking the Conservative option when there are constrained minor party options, but other party voters as well. This is reflected in pollsters such as Savanta and Ipsos - who have a higher structural vote for the Conservatives than other pollsters.
For what it’s worth, we think that asking unprompted voting intention is a better metric this far out from an election - but that closer to election day it makes sense for pollsters to show all the parties that are going to be there on the ballot paper. Ultimately it’s a judgement call, and there’s good arguments on both sides.

In the analysis that follows, we’ve collapsed prompted/unprompted responses to give total and headline vote share as in the table below. This holds up against a recent poll of polls, while the effect of ‘unprompting’ is visible.

So if we can agree there’s a distinct possibility that the Reform vote is being overstated by a couple of percentage points, this is made somewhat moot by the fact that their national vote share continues to increase into low double digits - and is now not far off their ancestor UKIP party’s 12.6% performance in 2015.
And all this, before a potential return of Nigel Farage. There’s been a lot of conversation about how little the party has been able to translate its vote share into real by-election and local election gains, so all eyes will be on the double by-election header coming later this month. A recent Survation constituency poll in Clacton, out earlier this month, certainly raised a few eyebrows with Reform polling only 18%. We would expect it to be structurally a lot higher than this, particularly in this constituency, if Reform were truly in the double digits.
To try and “de-Farage” a Reform voter analysis - there will be a lot of others polling his appeal - we wanted to look at what Reform voters actually think on different issues, on public policy and public services. In other words to treat them with a bit more sophistication than just seeing Reform voters as people who respond to a Farage bat signal once every 4 years. There is a great detail and nuance behind the third surge for the radical right in the last decade; the first being in 2013-2015, the second in 2019, and the third now, shown below by tracking voteshare of parties over time.

We know from regular public polling who Reform voters are - largely similar to UKIP and Brexit party voters that preceded them; older, non-university educated, semi-rural, or rural voters - who are the sharpest edge of the 52%-strong 2016 Leave coalition. What we’re really interested in, in this Bi_Focal is what they think and how they're positioned, and how similar the Conservative vote is Reform today.
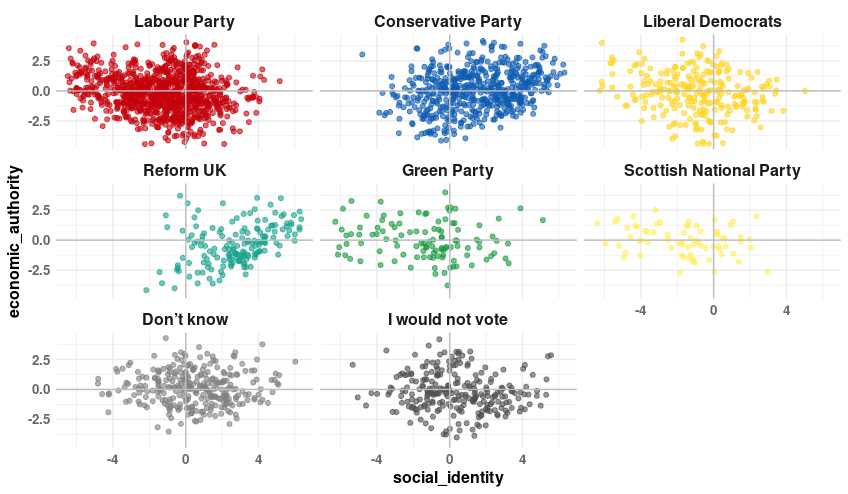
To explain similarities and differences among people’s attitudes, a modelling approach we’ve seen success with in the past is to run a principal component analysis (PCA) on the different questions we asked respondents about their social, economic and political attitudes.
This technique teases out deeper held, core preferences survey respondents have, which then help explain patterns of responses to more specific questions. It’s a standard technique that most pollsters or agencies deploy when going beyond cross-tabs. What we’ve done for this Bi_Focal is essentially reconstruct the political compass - where the vertical axis represents economic attitudes with the right wing free marketers at the top and socialist left wing voters at the bottom - and the horizontal axis acting as a social axis - with socially Conservative pro death penalty, tough on crime, anti-immigration voters are on the right hand side, and liberal cosmopolitan voters on the left.
Below you can get a sense of what each quadrant represents in terms of economic and social skew. We can also visualise where groups of respondents sit given their position on certain political questions.

Here we see how binary questions about some issues are neatly split along our social identity axis: the social right skew towards the view criminals are bad people at heart, gender is determined by birth and making Brexit work, while the social left supports gender self-identification, structural perspectives on crime and rethinking Brexit.

Other issues are split more traditionally, either both socially and economically left-wing – support for strikers, pro redistribution and income equality – or right-wing – tough on strikes, laissez-faire and anti income redistribution.

Finally, some issues upend the traditional left- and right-wing lens: culture war issues – immigration and racial discrimination – and ‘the elites are out of touch’ issues – like Net Zero and ULEZ – that separate affluent, progressive-presenting liberals from traditional, working-class segments of the public.

What we can also do - shown in the figures below - is plot each party's supporters on these same axes, along with the average position by party. Taking a look at these figures, the attitude map of Britain today has eight interesting features:

Looking at polling cross-breaks through this lens is a lot of fun. The age-gender curves plotted on these axes using our data really do back up the John Burn-Murdoch thesis on a global gender gap - which looks very acute for the youngest age cohorts.

Shifting the focus to Reform directly, we see the party as a threat to the Conservatives in terms of their past, present and future voters:
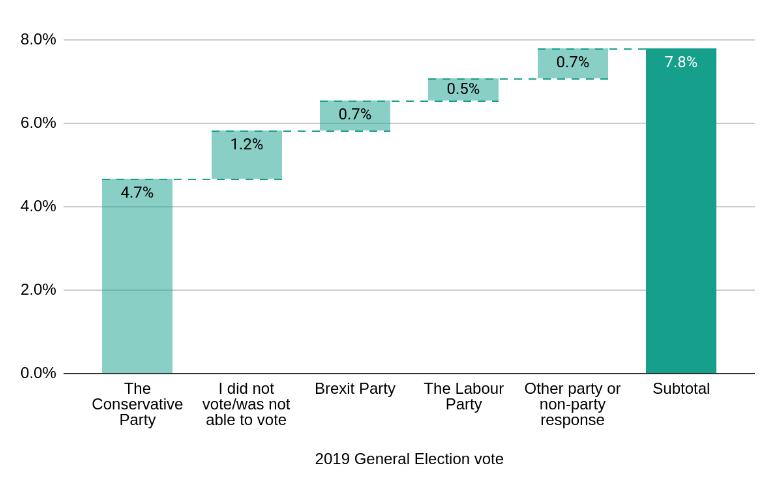
Reform’s ancestry is mixed, but is not reliant on previous Brexit Party voters. Party support leans heavily on ancestral Conservative 2019 supporters who’ve shifted allegiance, with over half (4.7%) of Reform’s total voteshare coming from those voting Conservative in 2019. Interestingly, the Brexit party gained upwards of 2% voteshare in 2019, but only 0.7% has shifted to Reform: we find the remainder dispersed evenly across Labour, Tories, Lid Dems and even some Greens!
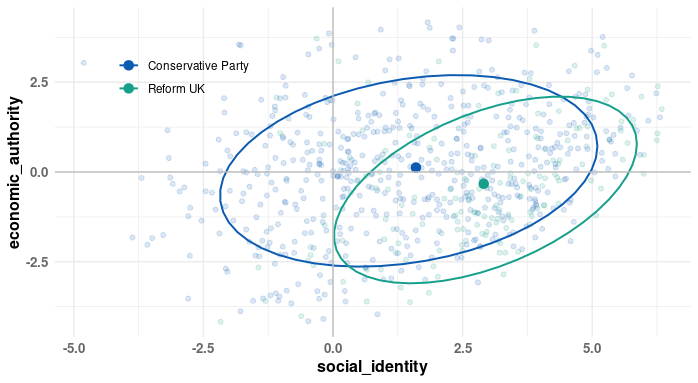
Not only is Reform pulling away a section of the Conservative voter base (4.7%, Threat 1), but it’s also standing in the way of the Government capturing new potential voters – those who didn’t vote Conservative previously but might otherwise have in the absence of a resurgent Reform party (Threat 2). This is highlighted in the useful - but complicated - graph below which visualises the different component parts of the current Reform coalition - and how many of Reform voters today who didn’t vote Conservative in 2019, look a lot like Conservative voters today.

The sheer overlap on social attitudes between Reform and Conservative voters today creates both large upside and downsides for the modern Conservative party. A look-a-like party that lends votes when it’s with you can balloon the party above 33/34%, but can crater you if they’re ascendant. We’ve seen both scenarios happen in just the last 5 years. For many reasons David Cameron’s 34-36% vote slice was a bit more demographically and attitudinally resilient, as it drew voters from across the political map. This may have lowered its potential ceiling for proper majorities, but it also gave it a floor.
Another hypothesis we wanted to test was whether the Reform party was merely a vehicle for disgruntled Conservatives. We ran an additional poll of Reform-only voters (n=468) to combine with our existing sample (n=171), for a larger sample (n=634) that allows a deep dive into Reform voter attitudes. We’re interested in how reasons for choosing Reform interact with some of these social and economic attitudes we’ve been exploring.
The table below shows possible responses to a question of why Reform supporters are choosing the party. What’s clear is that it’s wrong to think that the rise of Reform is purely down to disaffected Tory supporters. Only around half (54%) of Reform supporters choose anti-Conservative “push” options, with the other half (46%) choosing pro-Reform party “pull” responses.

Thinking about breaking Reform out into two buckets - push and pull voters - and then seeing how these Reform sub-groups compare to two other voter groups - Current 2024 Conservatives (who also voted Conservative in 2019) and Conservative 2019 defectors to Labour - you can begin to understand the scale and problem the Government faces. Just to remind you that each group comprise of:
For those of you who don’t want to wade through the 14 consecutive graphs below, there were 5 really interesting things that come from looking at the electorate through the lens of the above groups:
In Part 2, coming later this week, we analyse whether economic or social issues are driving public sentiment -- we'll see that politics is about both, and while economics is top of mind, social issues are the cheat code that continue to cleanly divide the public.


Focaldata online polling of 2,746 respondents in Britain. Fieldwork was carried out between 21/12/2023 and 16/01/2024. Data is weighted by reported age, gender, education, ethnicity, region and 2019 General Election vote.
This blog comes out as a newsletter before we publish on our website. If you'd like to get ahead of the curve, why not subscribe and get the next one straight to your inbox. You can also follow Focaldata on Twitter and LinkedIn.
Feel free to check out our previous editions of Bi_Focal:
We're on a mission to power the world’s understanding of what people think and do.
We research public opinion for data-driven organisations. With Focaldata, decision makers and researchers get the most rigorous data and analysis at 5x the speed — reducing the time to decision while delivering uncommonly actionable insights. We are a team of engineers, data scientists, product specialists and researchers building outstanding technology and next-generation services. Our services are global. We are non-political and non-ideological.
Find our more: www.focaldata.com
Sign up to receive the next issue of Bi_Focal
If you have any thoughts or feedback, please email me at james@focaldata.com.

